Following "Find what JavaScript variables are leaking into the global scope", here's another post to help you solve issues with global scope pollution in JavaScript apps.
In the previous post, we learned a technique to discover the name of variables being added to the global scope by JavaScript code. Just knowing the global variable names is usually enough to determine 1) if it's ok or not for the variable to live in the global scope and, if it's not, 2) what line of JavaScript code is adding it to the global scope.
Still, sometimes tracking down the JavaScript code responsible for creating a global variable is not that straightforward — for example, when the global variable name is extremely generic (e.g., item, x, etc.) or when the code that creates the global is deep into the dependency tree of your JavaScript app.
So, here's how to build (from scratch) a JavaScript utility that can help us debugging where the global definitions are happening within out code.
Here's a real-world example where this utility has helped me track-down a global variable leak coming from third-party JavaScript code.
Global pollution example
As an example, let's focus again on the HTML document I shared in the previous post:
<html>
  <body>
    <h1>Hello world!</h1>
    <script src="https://unpkg.com/jquery@3.6.0/dist/jquery.js"></script>
    <script>
      function doSomethingTwice() {
        for (i = 0; i <= 2; i++) {
          const myString = `hello-world-${i}`;
          // Let's imagine we're going to do something with myString here...
        }
      }
      doSomethingTwice();
    </script>
  </body>
</html><html>
<body>
<h1>Hello world!</h1>
<script src="https://unpkg.com/jquery@3.6.0/dist/jquery.js"></script>
<script>
function doSomethingTwice() {
for (i = 0; i <= 2; i++) {
const myString = `hello-world-${i}`;
// Let's imagine we're going to do something with myString here...
}
}
doSomethingTwice();
</script>
</body>
</html>The two scripts on the page (jquery.js and the inline one) add four different global variables: $ and jQuery from jquery.js, and doSomethingTwice and i from the inline script.
Because of how popular jQuery is, the $ and jQuery global names are pretty easy to associate with the library that creates them (and understand that they're not global leaks).
The story is different for the two other globals, though:
doSomethingTwiceis added to the global scope because it's defined at the root scope (a cleaner approach would be to wrap it in a closure/IIFE). Finding the code responsible for creating this global shouldn't be difficult with a search & replace in the codebase becausedoSomethingTwiceis quite a unique name. But what if the global name was more generic (e.g.,run), or if the code was uglified/minified or if it comes from a dependency? That would make it way more difficult to track its declaration down just based on its name.iis (mistakenly) added to the global scope because we're declaring it with novar/let/constwhile not being in strict mode. In this small example, it's rather obvious what line of code declares it. But good luck tracking it down with a search & replace in a bigger app 😅.
So, let's see how we can make it easy to track down the line of codes responsible for setting global variables in our codebase.
Step 1: inspecting the call stack
Here's a high-level overview of what we can do to help us track down these pesky global variables:
- Take note of the exact global variable name I want to track down (following "Find what JavaScript variables are leaking into the global scope").
- Proxy the
setinstruction of such variable on thewindowobject to trigger some custom code when the variable is set. The goal of this code is to point out "what" is setting the global variable.
I've already covered the first step in the past, so let's focus on the second one: proxying the window (or globalThis) object.
The idea here is that whenever an assignment like window.i = 1 happens, we want to run some code that tells us the context of where that assignment happened. To be useful, this context should provide us some information about the code that is running it (e.g., tell us the line of code or file where the declaration happened).
Here are a couple of ways to get this info:
- When the global declaration happens, halt the code execution with a
debugger;statement to inspect the context — this is exactly like adding a breakpoint in the script source, and it's helpful for debugging the scope and closures. - When the global declaration happens, print the stack trace using
console.trace(). This is helpful to inspect the stack trace's code even while the execution is running.
We'll implement both solutions using an onGlobalDeclaration function:
function onGlobalDeclaration(globalName) {
  // Print the stack trace to the console.
  console.trace();
  // Halt the code execution (only if the DevTools are running).
  debugger;
}

// TODO: Code that attaches the onGlobalDeclaration listener.
function onGlobalDeclaration(globalName) {
// Print the stack trace to the console.
console.trace();
// Halt the code execution (only if the DevTools are running).
debugger;
}
// TODO: Code that attaches the onGlobalDeclaration listener.Step 2: proxying window attributes
Now that we can get some contextual information about the stack, how can we attach invoke onGlobalDeclaration when the global variable is set?
In the past, I tried a few different options, but to me the one that works better is to instantiate the global variable ourselves as a proxy before it gets set by the rest of our codebase.
Basically, before a window.i = 1 statement runs, we want to instantiate window.i ourselves and override its setter function so that, whenever it's invoked, we also invoke onGlobalDeclaration:
function addGlobalToInspect(globalName) {
  function onGlobalDeclaration(globalName) {
    // Print the stack trace to the console.
    console.trace();
    // Halt the code execution (only if the DevTools are running).
    debugger;
  }

  // Proxy the global variable that we're interested in.
  Object.defineProperty(window, globalName, {
    set: function (value) {
      // Invoke onGlobalDeclaration and set the value in a proxy attribute.
      onGlobalDeclaration(globalName);
      window[`__globals-debugger-proxy-for-${globalName}__`] = value;
    },
    get: function () {
      // When the global is requested, return the proxy attribute value.
      return window[`__globals-debugger-proxy-for-${globalName}__`];
    },
    configurable: true,
  });
}

// Inspect the strack whenever an "i" variable is added to the global scope.
addGlobalToInspect("i");
function addGlobalToInspect(globalName) {
function onGlobalDeclaration(globalName) {
// Print the stack trace to the console.
console.trace();
// Halt the code execution (only if the DevTools are running).
debugger;
}
// Proxy the global variable that we're interested in.
Object.defineProperty(window, globalName, {
set: function (value) {
// Invoke onGlobalDeclaration and set the value in a proxy attribute.
onGlobalDeclaration(globalName);
window[`__globals-debugger-proxy-for-${globalName}__`] = value;
},
get: function () {
// When the global is requested, return the proxy attribute value.
return window[`__globals-debugger-proxy-for-${globalName}__`];
},
configurable: true,
});
}
// Inspect the strack whenever an "i" variable is added to the global scope.
addGlobalToInspect("i");Note on ES6 proxies: ES6 introduced the
Proxyobject to cover similar use-cases. If you're not familiar with it, theProxyobject allows you to create an object that can be used in place of the original object, but which may redefine fundamental Object operations like getting, setting, and defining properties.
Unfortunately, theProxyobject doesn't work well for our use case because of how thewindowobject is implemented at the browser level (with proxies, we'd need to override it with its own proxy instance, which we can't do), so we need to fallback to the monkey-patching approach.
Nice! Now our code is (kinda) ready to intercept globals declaration.
The next step is to ensure we run addGlobalToInspect before the global declarations statement.
Step 3: integrating the global inspector
We still need to do two things to finalize our debugging flow.
First of all, we must make sure to run addGlobalToInspect before setting the global we want to inspect. It's up to you to decide how and when to do so, but my suggestion is to put the global inspector code in its own .js file (e.g., globals-debugger.js) and make sure to load it before all other scripts:
 <html>
   <body>
     <h1>Hello world!</h1>
+    <!--
+      Make sure to load globals-debugger.js first.
+      It might be wise to load it conditionally depending on the environment
+      (e.g., do not load it in production).
+    -->
+    <script src="./globals-debugger.js"></script>
     <script src="https://unpkg.com/jquery@3.6.0/dist/jquery.js"></script>
     <script>
       function doSomethingTwice() {
         for (i = 0; i <= 2; i++) {
           const myString = `hello-world-${i}`;
           // Let's imagine we're going to do something with myString here...
         }
       }
       doSomethingTwice();
     </script>
   </body>
 </html>
<html>
<body>
<h1>Hello world!</h1>
+ <!--
+ Make sure to load globals-debugger.js first.
+ It might be wise to load it conditionally depending on the environment
+ (e.g., do not load it in production).
+ -->
+ <script src="./globals-debugger.js"></script>
<script src="https://unpkg.com/jquery@3.6.0/dist/jquery.js"></script>
<script>
function doSomethingTwice() {
for (i = 0; i <= 2; i++) {
const myString = `hello-world-${i}`;
// Let's imagine we're going to do something with myString here...
}
}
doSomethingTwice();
</script>
</body>
</html>Then, it would be nice to pick the globals to inspect dynamically instead of hardcoding them in the code like we're doing now (as we're doing with addGlobalToInspect("i")).
Since our script runs ASAP, I think the easiest way to pass the global names as parameters is by appending them to URL as query parameters.
For example, we can change our script so that when the page is loaded with ?globalsToInspect=i,jQuery in the URL, it will automatically start inspecting for the i and jQuery globals:
// Grab the global to inspect from the URL's "globalsToInspect" query parameter.
const parsedUrl = new URL(window.location.href);
(parsedUrl.searchParams.get("globalsToInspect") || "")
  .split(",")
  .filter(Boolean)
  .forEach((globalToInspect) => addGlobalToInspect(globalToInspect));
// Grab the global to inspect from the URL's "globalsToInspect" query parameter.
const parsedUrl = new URL(window.location.href);
(parsedUrl.searchParams.get("globalsToInspect") || "")
.split(",")
.filter(Boolean)
.forEach((globalToInspect) => addGlobalToInspect(globalToInspect));Complete solution: globals-debugger.js
Before finally trying the globals debugger, here's the complete code (with comments and a couple of additional safety checks):
/**
 * GlobalsDebugger
 *
 * Inspect the stack when a global variable is being set on the window object.
 * Given a global variable name, it proxies the variable name in the window
 * object adding some custom code that will be invoked whenever the variable
 * is set. The custom code will log the current stack trace and halt the code
 * execution to allow inspecting the stack and context in your browser DevTools.
 * You can use the "globalsToInspect" query-parameter to set a comma-separated
 * list of names of the variables you want to inspect.
 * Additionally, you can also add globals to inspect at runtime by invoking
 * "window.__globalsDebugger__.addGlobalToInspect(globalName)" (which will be
 * useful only if you expect these globals to be set asynchronously after you
 * invoked addGlobalsToInspect).
 */
window.__globalsDebugger__ = (function createGlobalsDebugger() {
  // Name of the variables to inspect.
  const globalsToInspect = [];

  // Name of the variables that have already been inspected once.
  const inspectedGlobals = [];

  /**
   * Given a global variable name, halt the code execution when the variable
   * gets set to allow inspecting the stack (to debug what line of code is
   * setting it).
   * @param {string} globalName Name of the global variable to inspect.
   */
  function addGlobalToInspect(globalName) {
    if (!globalsToInspect.includes(globalName)) {
      globalsToInspect.push(globalName);
    }
    // Proxy the global variable that we're interested in to log the stack trace
    // halt the execution when it gets set.
    Object.defineProperty(window, globalName, {
      get: function () {
        return window[`__globals-debugger-proxy-for-${globalName}__`];
      },
      set: function (value) {
        // To avoid noise in case the global is set multiple times, run the
        // inspection only the first time the variable is set.
        if (!inspectedGlobals.includes(globalName)) {
          inspectedGlobals.push(globalName);
          // Print the stack trace to the console.
          console.trace();
          // Halt the code execution (only if the DevTools are running).
          debugger;
        }
        window[`__globals-debugger-proxy-for-${globalName}__`] = value;
      },
      configurable: true,
    });
  }

  // Start inspecting the global variables listed in the "globalsToInspect"
  // query parameter.
  const parsedUrl = new URL(window.location.href);
  (parsedUrl.searchParams.get("globalsToInspect") || "")
    .split(",")
    .filter(Boolean)
    .forEach((globalToInspect) => addGlobalToInspect(globalToInspect));

  return {
    addGlobalToInspect,
  };
})();
/**
* GlobalsDebugger
*
* Inspect the stack when a global variable is being set on the window object.
* Given a global variable name, it proxies the variable name in the window
* object adding some custom code that will be invoked whenever the variable
* is set. The custom code will log the current stack trace and halt the code
* execution to allow inspecting the stack and context in your browser DevTools.
* You can use the "globalsToInspect" query-parameter to set a comma-separated
* list of names of the variables you want to inspect.
* Additionally, you can also add globals to inspect at runtime by invoking
* "window.__globalsDebugger__.addGlobalToInspect(globalName)" (which will be
* useful only if you expect these globals to be set asynchronously after you
* invoked addGlobalsToInspect).
*/
window.__globalsDebugger__ = (function createGlobalsDebugger() {
// Name of the variables to inspect.
const globalsToInspect = [];
// Name of the variables that have already been inspected once.
const inspectedGlobals = [];
/**
* Given a global variable name, halt the code execution when the variable
* gets set to allow inspecting the stack (to debug what line of code is
* setting it).
* @param {string} globalName Name of the global variable to inspect.
*/
function addGlobalToInspect(globalName) {
if (!globalsToInspect.includes(globalName)) {
globalsToInspect.push(globalName);
}
// Proxy the global variable that we're interested in to log the stack trace
// halt the execution when it gets set.
Object.defineProperty(window, globalName, {
get: function () {
return window[`__globals-debugger-proxy-for-${globalName}__`];
},
set: function (value) {
// To avoid noise in case the global is set multiple times, run the
// inspection only the first time the variable is set.
if (!inspectedGlobals.includes(globalName)) {
inspectedGlobals.push(globalName);
// Print the stack trace to the console.
console.trace();
// Halt the code execution (only if the DevTools are running).
debugger;
}
window[`__globals-debugger-proxy-for-${globalName}__`] = value;
},
configurable: true,
});
}
// Start inspecting the global variables listed in the "globalsToInspect"
// query parameter.
const parsedUrl = new URL(window.location.href);
(parsedUrl.searchParams.get("globalsToInspect") || "")
.split(",")
.filter(Boolean)
.forEach((globalToInspect) => addGlobalToInspect(globalToInspect));
return {
addGlobalToInspect,
};
})();globals-debugger.js usage example
Finally, here's an example of using what we just built to track down the i global creation.
Note: This is just a simplified use-case to show you the
globals-debuggeruse-flow. In a more realistic scenario you would probably use it to track down globals added in bigger codebases or from third-party libraries deep down the dependencies tree.
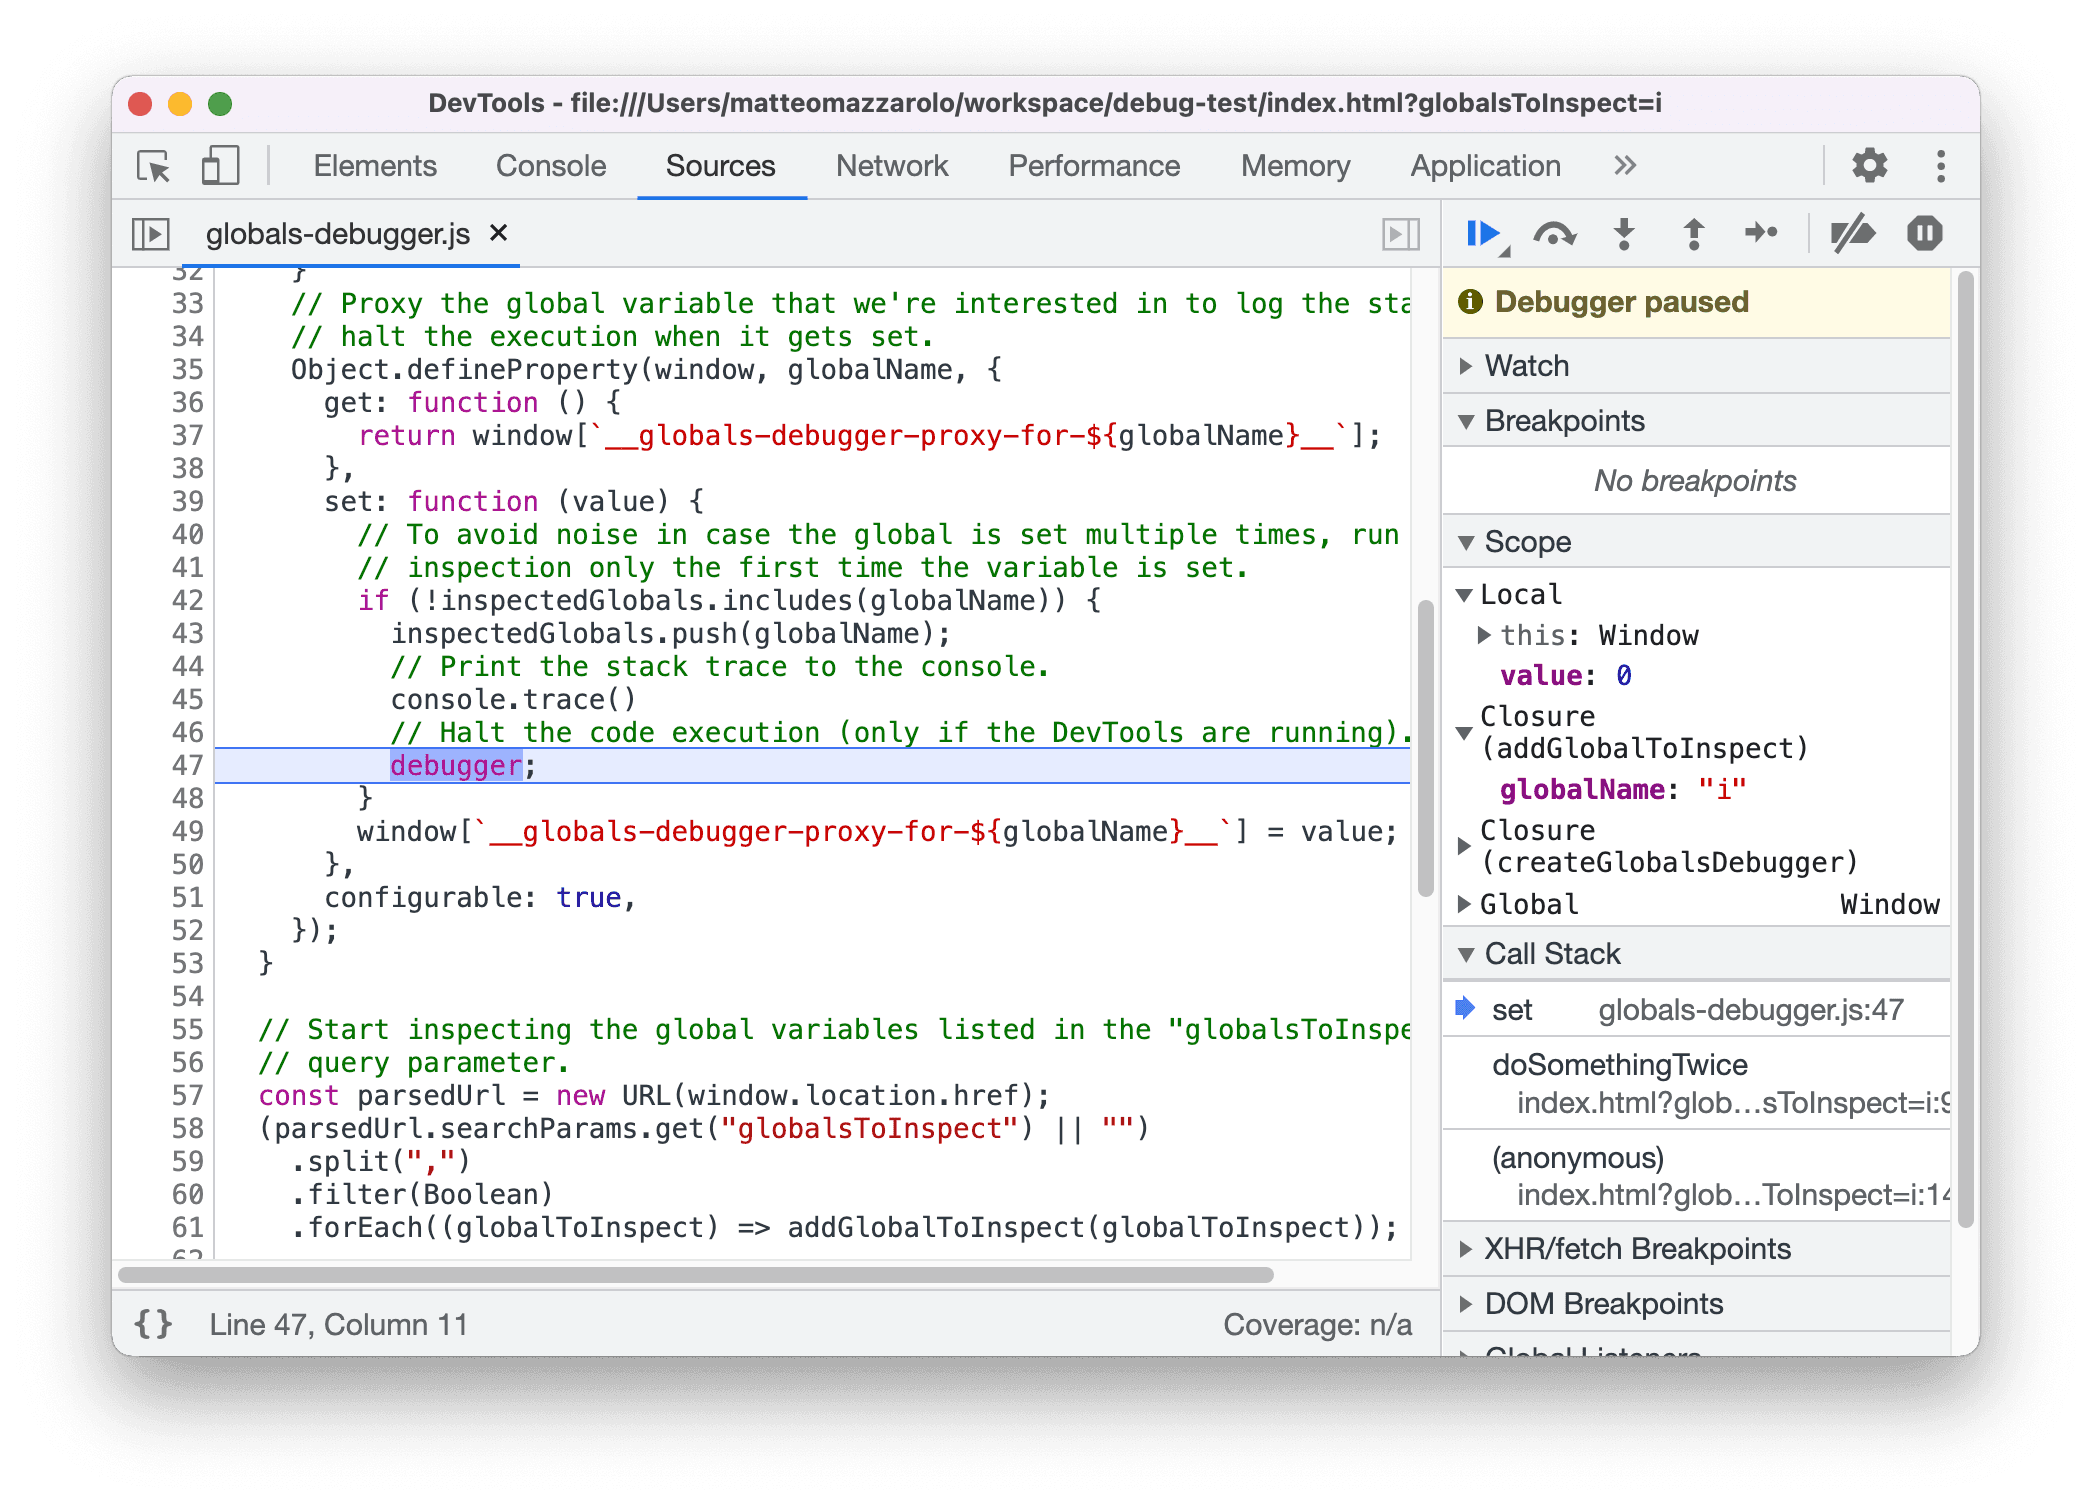
Opening the HTML page above with the ?globalsToInspect=i query parameter will immediately pause the code execution when the i variable is being set (notice that the globalName variable in the current closure is i in the right panel):

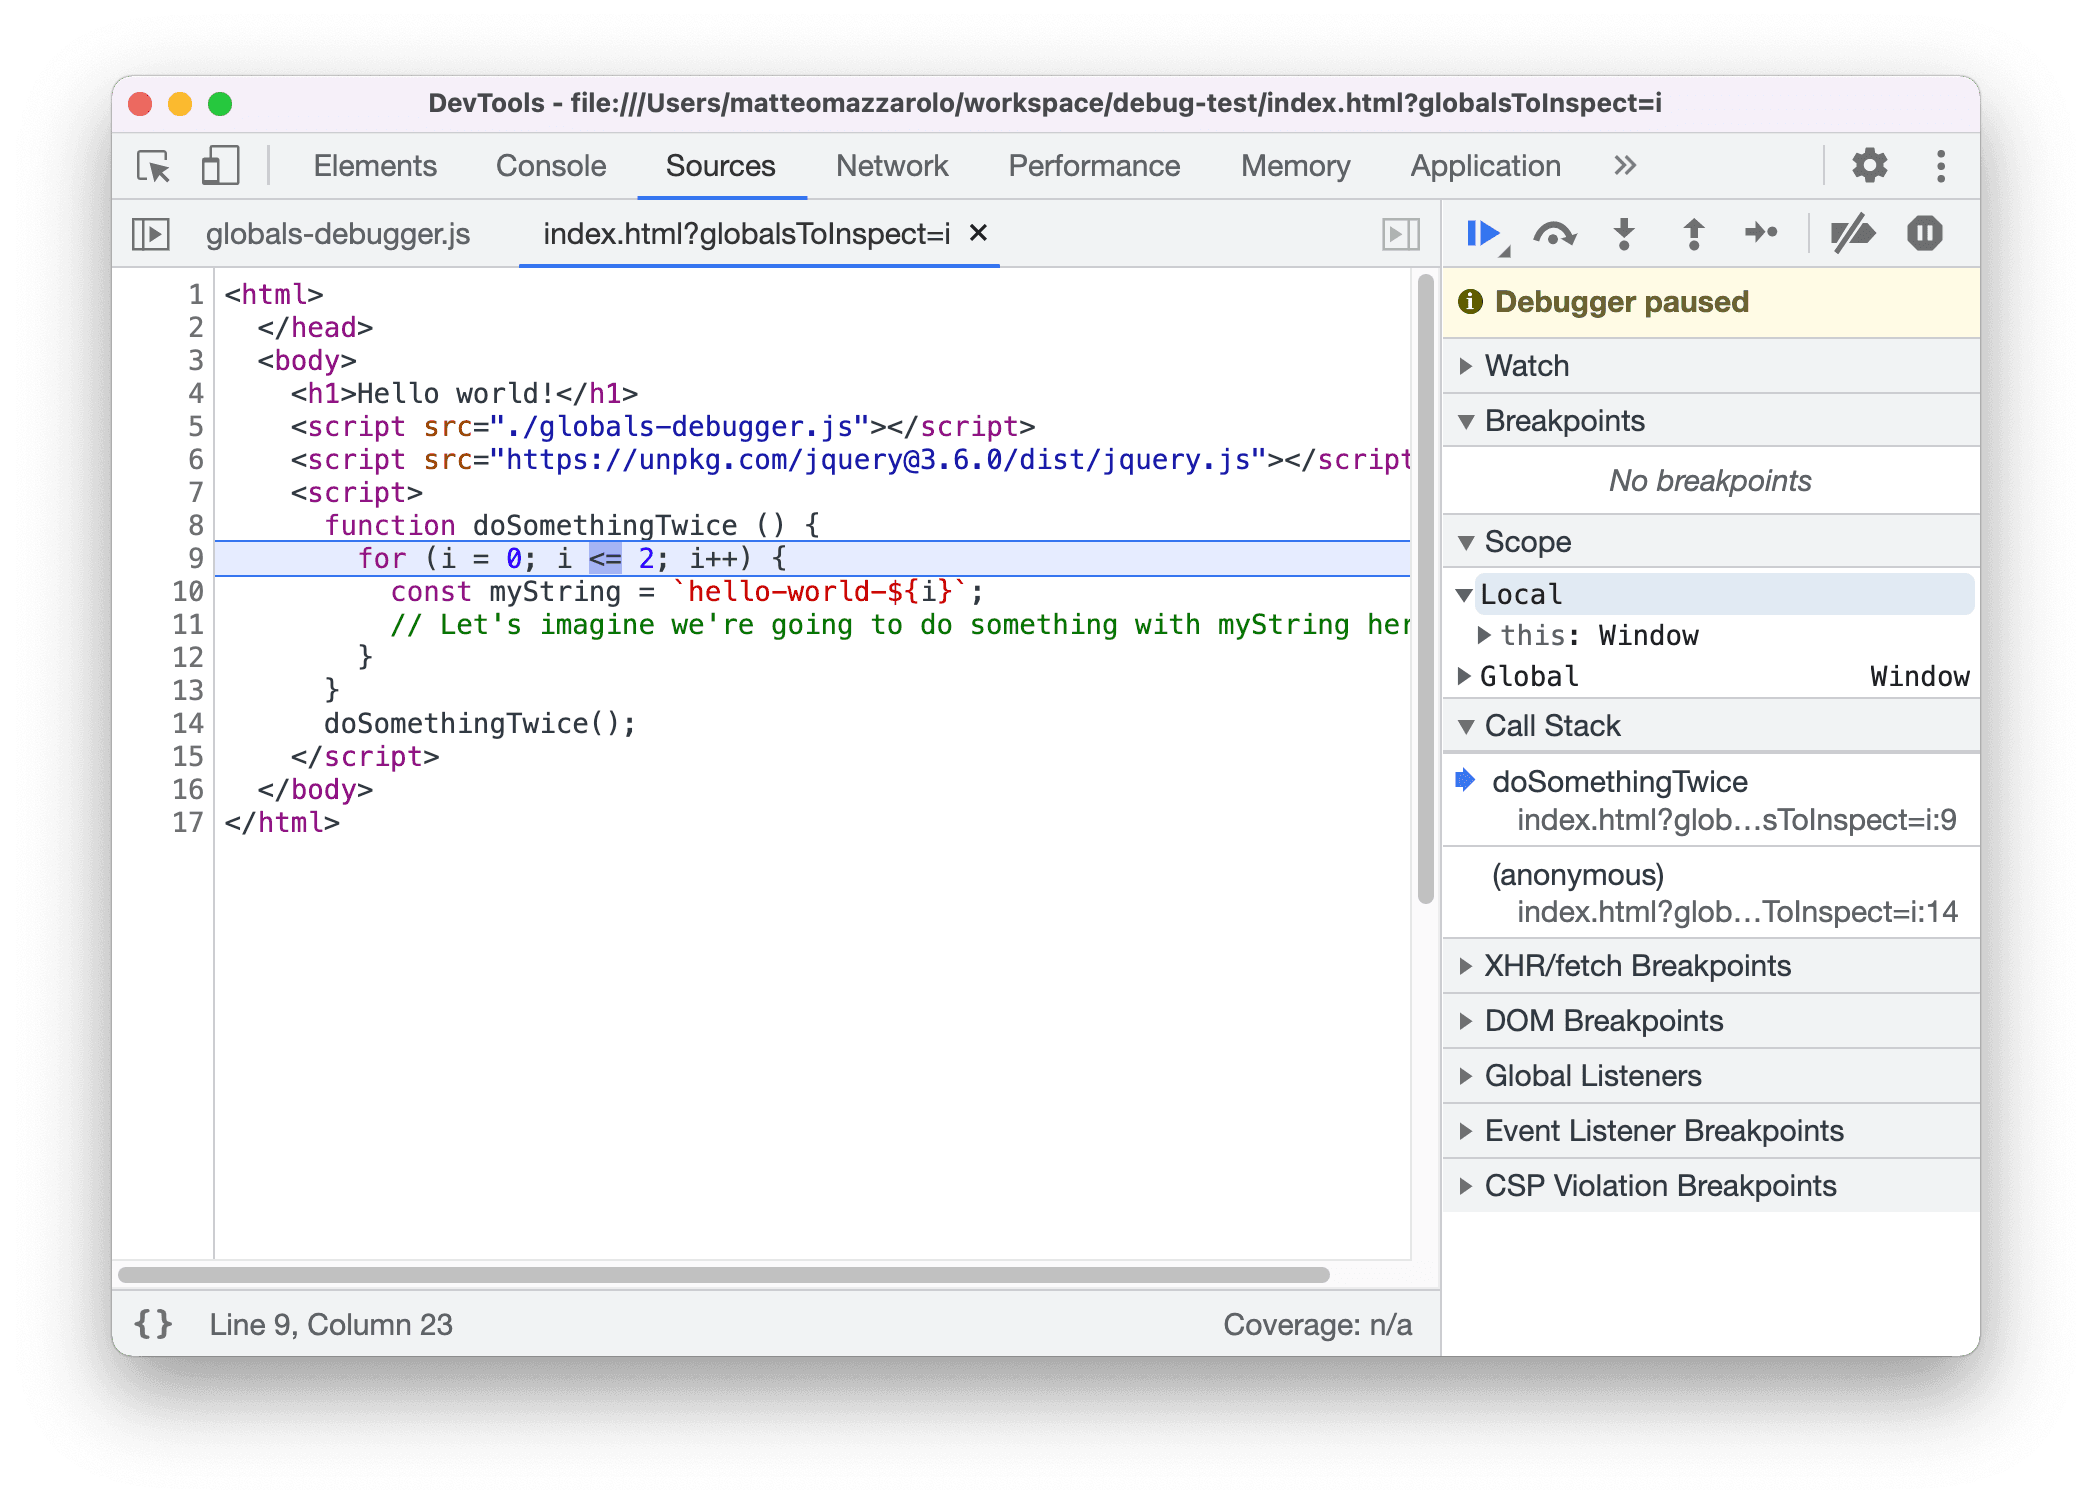
Since the debugger; statement is in our own code, we need to step out of the current function (Shift + F11), to land on the exact line of code that is setting the i variable:

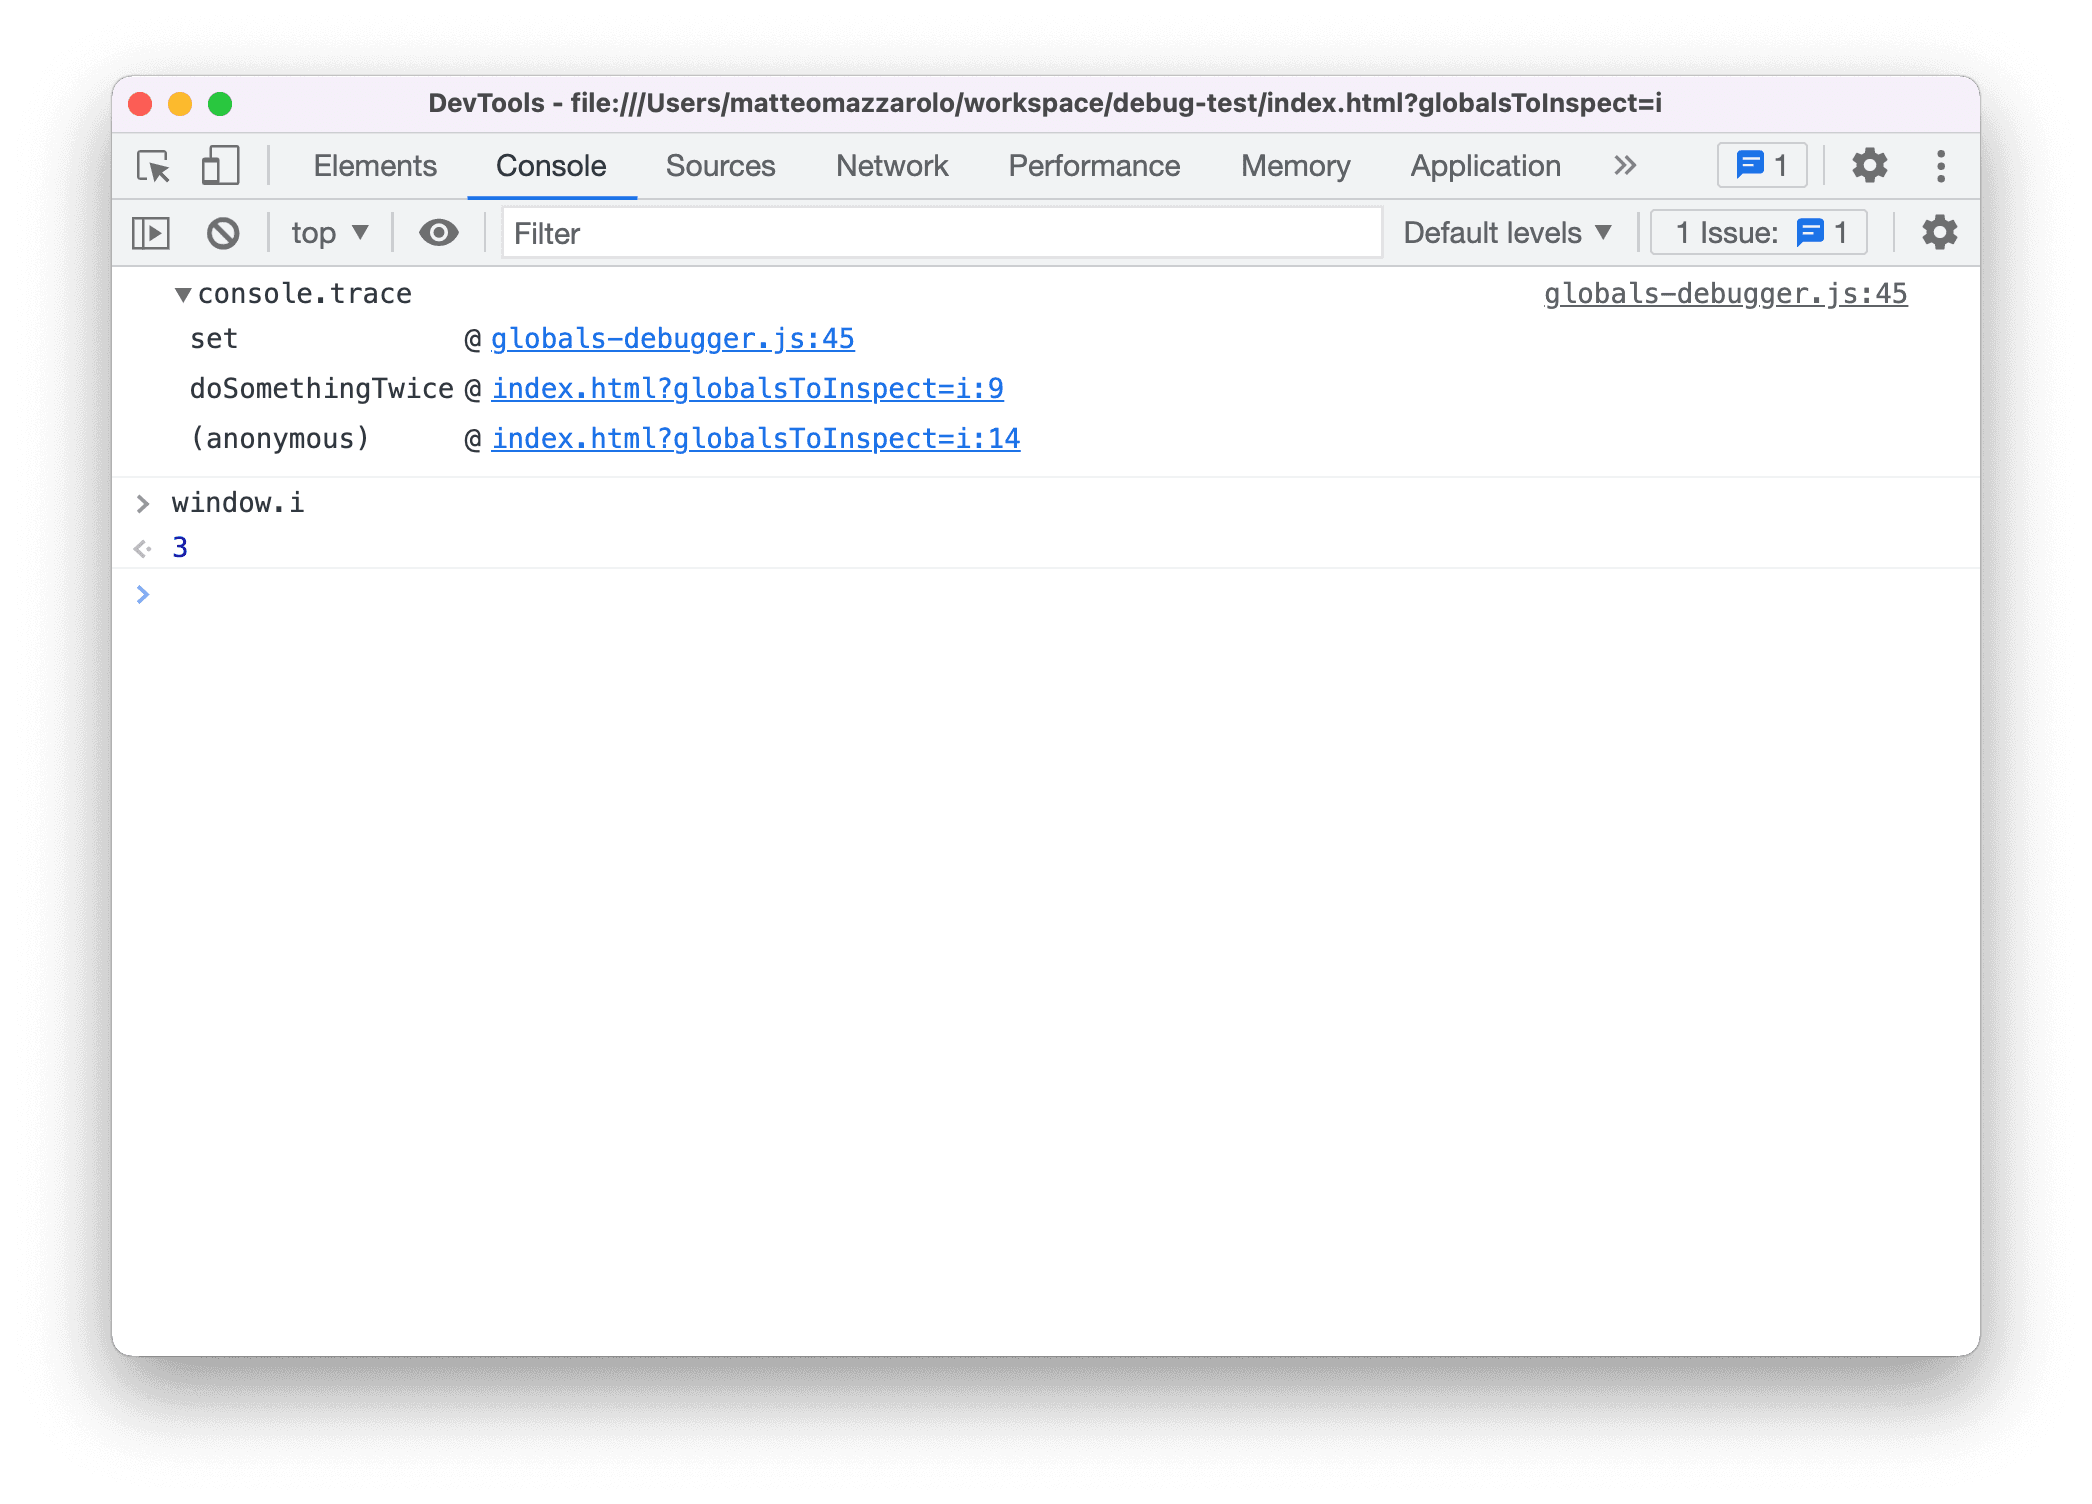
Last but not least, if we check the DevTools console we'll see the logged stack trace, which is helpful to inspect the stack even while the script is running. Also, we can validate that, even if proxied, the global variables are still working correctly:
